Seed and food production, nutrition and income security
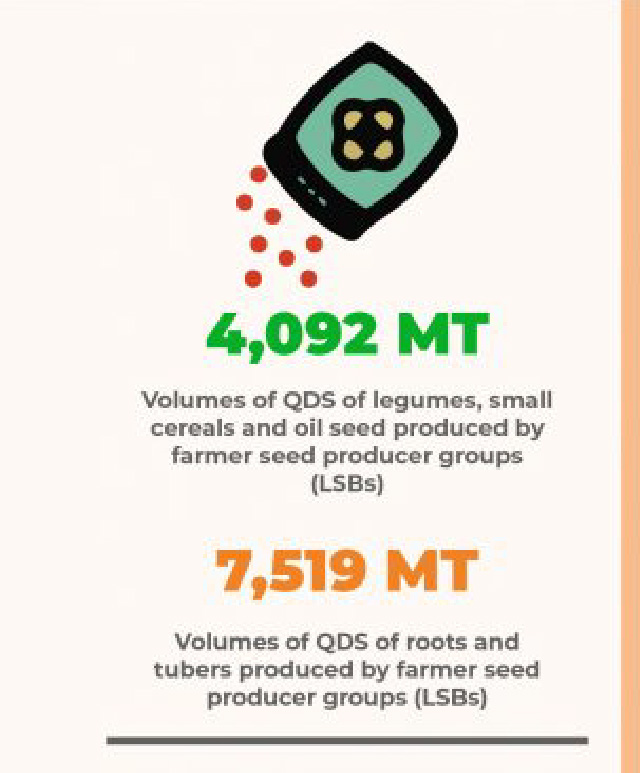
- 4,092 MT - Volumes of QDS of legumes, small cereals and oil seed produced by farmer seed producer groups (LSBs). 7,519 MT - Volumes of ODS of roots and tubers produced by farmer seed producer groups (LSBs)
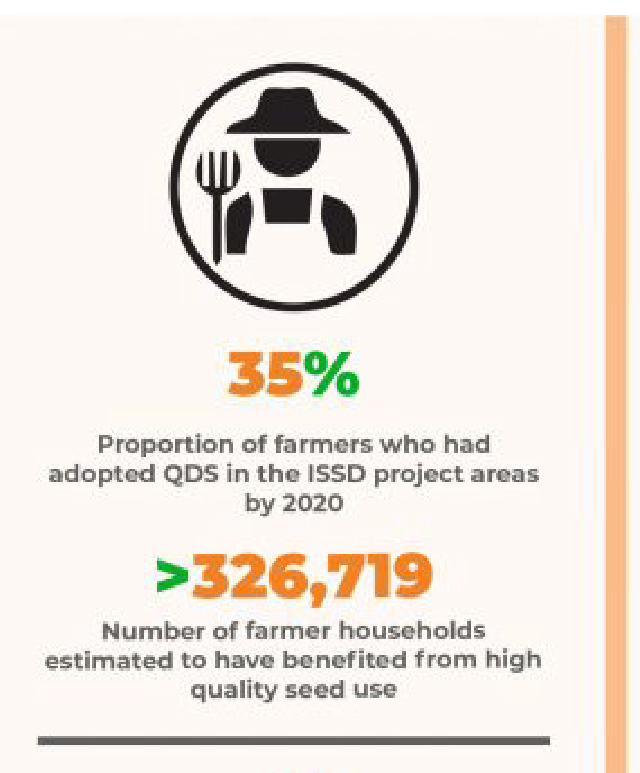
- 35% - Proportion of farmers who had adopted ODS in the ISSD project areas by 2020. >326,719 - Number of farmer households estimated to have benefited from high quality seed use.
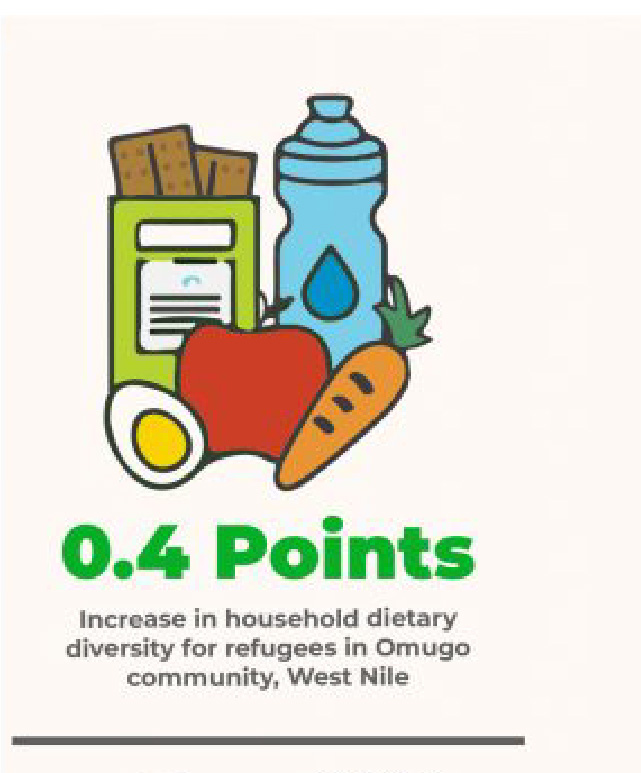
- 0.4 Points - Increase in household dietary diversity for refugees in Omugo community, West Nile
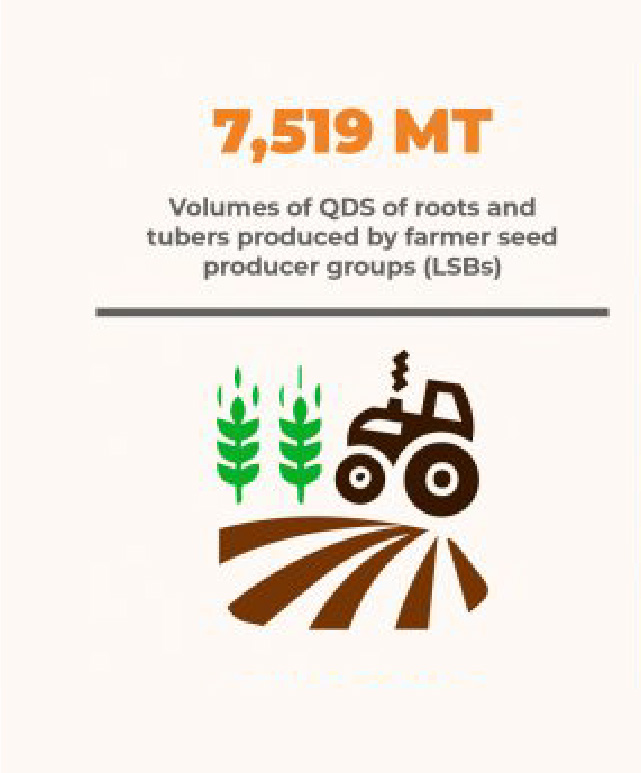
- 7,519 MT - Volumes of ODS of roots and tubers produced by farmer seed producer groups (LSBs)
- >171,600 MT - Quantity of additional food produced by farmers as a result of using quality seed from farmer seed producer groups (LSBs).
- 97.5% - Proportion of refugee host community households that had the appropriate food consumption score
- 2.19 - Odds ratio (OR) that the benefit of exposure of refugees to the NIGI project led to increased consumption of vegetables
- 11,014 MT - Quantity of Iron-rich food produced from quality seed of iron rich bean varieties. 5,498 MT - Quantity of Vitamin A-rich food that was produced from quality seed of Vitamin A rich sweet potato varieties
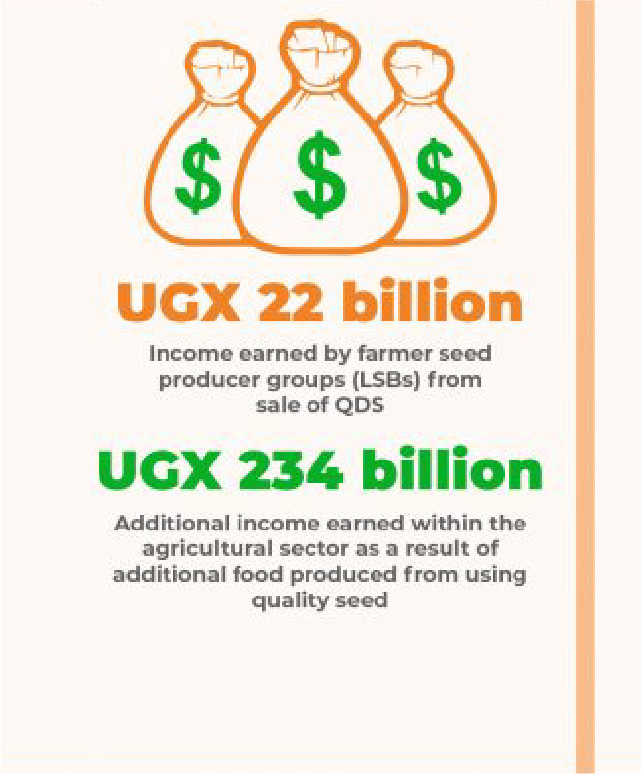
- UGX 22 billion - Income earned by farmer seed producer groups (LSBs) from sale of ODS. UGX 234 billion - Additional income earned within the agricultural sector as a result of additional food produced from using quality seed
More Achievements
Our Development Partners